FROGscan Data


The primary advantage of FROGscan is that it combines the wide wavelength range needed to measure very short pulses, with the spectral resolution required to large, high order phase distortions and temporally long pulses.
The screen captures to the left show measurements of shaped pulses demonstrate this unique capability. The pulse shaper was a standard 4f design with two 128 element LCDs to control both intensity and phase of the pulse. The spectral phase was set using a 6th order polynomial, and intensity was typically set to unity except for a few of the pulses where the central portion of the spectrum was removed.
For some of the pulses, so much spectral phase was added that the pulse shaper was clearly aliasing–it no longer has the resolution required to produce a smooth, wrapped phase, which causes the pulse to break up. You cannot measure pulses like these with any other pulse measurement system available.
FROGscan Data is included with FROGscan, FROGscan Ultra and X-FROGscan
I. To the left is a pulse with pure cubic spectral chirp. As with the case when cubic spectral chirp is added to a pulse, ringing occurs in the time domain representation of the pulse. In an autocorrelation, this ringing shows up as smooth wings extending beyond the central peak. You can clearly see that the main pulse width is less than 80 fs while the ringing extends past 500 fs. Also notice that the pi phase steps at every pulselet are clearly defined. In addition, you can clearly see that FROG Scan’s unique capability of a variable time window allows the entire pulse to be contained in the time window allowing large amounts of cubic chirp to be measured. This cannot be done with a single-shot FROG device.
II. Pictured on the left is the screen capture of VideoFROG FROG scan measuring a pulse with fourth, fifth, and sixth order components of the spectral phase. In addition, the center portion of the spectrum is removed. The main portion of the pulse is about 70 fs wide while the pedestal spans about 1 ps. The ringing on the left portion of the central peak is indicative of odd order phase. Here, the entire pedestal of the pulse extends over 1 ps, which demonstrates the power of the completely tunable optical delay and time window in the FROG Scan system.
III. This pulse has large amounts of cubic and quartic spectral chirp–enough to influence of the pulse spectrum because of greater than pi phase shifts in the spectrum. Notice that to the left of the central pulse, there is some ringing, and to the left, the ringing has a higher frequency. Also notice that the base of the pulse spans 2 ps! The added pulses to the left occur because of the large amount of higher order spectral phase.
IV. Pulse shapers have limitations, and this pulse demonstrates that FROG Scan is capable of measuring these limitations. So much quartic spectral chirp was added that the pulse shaper aliased the phase. In other words, adjacent pixels changed the phase by more than 2pi, causing a highly structured spectrum and a poorly defined spectral phase. The time domain pulse is comprised of three primary pulses that range over about 1.5 ps. The narrowest of the pulses is about 25 fs in width. Such level of detail in the wings of the pulse can only be achieved using a 16-bit detector, which gives FROG Scan its unprecedented ability to measure long pulse pedestals underlying short pulses.
Not only is VideoFROGscan fast–it easily tracks phase changes from a pulse shaper, it is accurate too. The following plots show data taken using VideoFROG. I used a pulse shaper (zero-dispersion stretcher-compressor with an LCD spatial light modulator) and a FROG system to measure changes in the spectral phase of an ultrashort laser pulse induced by the pulse shaper.
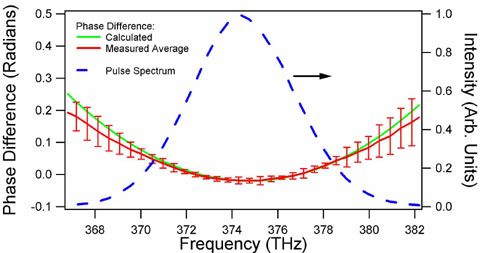
Shown above are the results from 12 different measurements of 12 different amounts of linear chirp (quadratic spectral phase). An equal amount of linear chirp is added to each measurement. The amount of chirp varies from transform limited to modest amounts of spectral chirp. VideoFROG was only allowed to settle for the time it took to notice the phase change and save the data (~ 1 sec).

Shown above is a plot comparing the calculated difference between each phase measurement and the measured difference. Where the intensity is highest, the phase accuracy is better than 0.01 radians while the precision is ~0.02 radians or better. In the wings, where the intensity is nearly zero, the phase accuracy is ~0.05 radians while the precision is ~ 0.1 radians. Only an interferometer can do better!
Also included with FROGscan, Ultra & X:
VideoFROGscan
VideoFROG Scan has versatile data acquisition, processing, and display. For ultrafast laser pulse measurement systems, the software is just as important as the hardware. VideoFROG Scan is the premier real-time FROG pulse measurement software available.
